National Atlas of Hungary - Antecendents
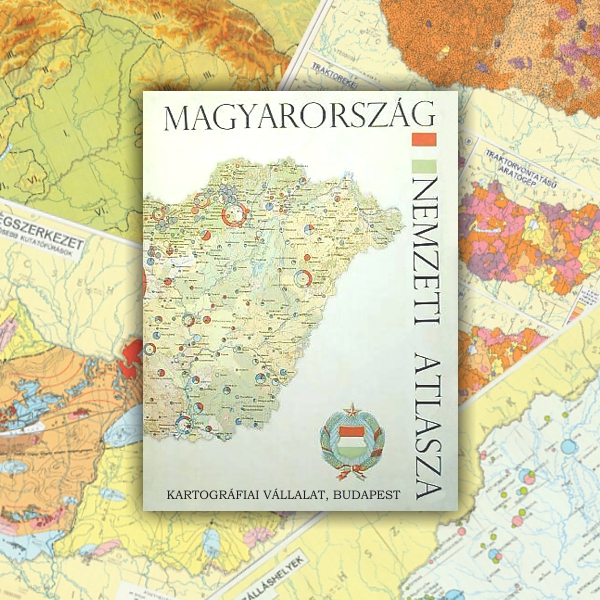
Sándor Radó (Editor-in-Chief) 1967. National Atlas of Hungary.
Preparations for the first official national atlas were started in 1959, relying on the recommendations of the Commission on National Atlases of the International Geographical Union. The work was directed by Sándor Radó, editor-in-chief. The atlas (29 x 40.6 cm in size) was published on 112 pages in 1967 with the scientific cooperation of the Hungarian Academy (mainly its Geographical Committee) and the cartographic collaboration of Cartographia Company. The aim of the atlas was to support “economic management and planning” and develop knowledge about the country. Consequently, the first “cartographic ID” of the People's Republic of Hungary was published in red binding. It had 280 maps in colour (mostly at 1:1 million to 1:2 million scales); almost 60% of the maps showed the state of the socialist national economy, a third represented the natural environment, while slightly more than one tenth of the maps dealt with Hungarian society (mainly with population and settlements).
Book review 1: Tivadar Bernát - László Lackó: On the National Atlas of Hungary. (in Hungarian). Published in Földrajzi Közlemények (Geographical Review) 93/2. 151-161. (1969) (PDF, ~3.8 MB)
Book review 2: József Sziládi: National Atlas of Hungary. (in Hungarian) Published in Geodézia és Kartográfia. (Geodesy and Cartography) 19/5. 364-367. (1967) (PDF, ~2 MB)
Content
Click on the chapters to access the full text!
1. |
COVER PAGES, FOREWORD, CONTENTS (9.8 MB) | |
5. |
||
6. |
Geomagnetism I – Geomagnetism II – Geomagnetism III – Epicentres of earthquakes 1880–1956 – Geomagnetism IV |
|
7. |
Tectonic map of the Alps, the Carpathian Mountains and the Balkan Mountains | |
8. |
Tectonics and major exploration wells | |
9. |
Palaeogeography: Upper Permian, Lower Triassic, Upper Triassic, Lower Jurassic, Middle Jurassic, Lower Cretaceous, Middle Cretaceous, Middle Cretaceous, Upper Cretaceous, Lower Eocene, Upper Eocene, Lower Oligocene, Upper Oligocene, Lower Miocene, Middle Miocene, Middle Miocene, Middle Pliocene |
|
10-11. |
Geology | |
12. |
Mineral resources I | |
13. |
Mineral resources II | |
14-15. |
Physical map | |
16-17. |
Geomorphological landscape types | |
18-19. |
Geomorphology | |
20. |
Relief energy | |
21. |
||
22. |
Climate: January mean temperature – April mean temperature – July mean temperature – October mean temperature – Mean temperature of the growing season, April to September – Annual mean temperature – Mean annual highest temperature – Mean annual lowest temperature – Mean date of first air frost in autumn – Mean annual number of winter days – Mean date of last air frost in spring – Mean annual number of summer days |
|
23. |
Climate: January precipitation – April precipitation – July precipitation – October precipitation – Annual precipitation – Limit value of 25% probability of precipitation in the growing season – Limit value of 50% probability of precipitation in the growing season – Limit value of 75% probability of precipitation in the growing season – Annual number of days with at least 1 mm precipitation – Annual number of days with at least 20 mm precipitation – Annual number of days with snowfall – Annual number of days with at least 50 mm precipitation in 50 years |
|
24. |
Climate: Vapour pressure in January – Humidity at 2 PM in January – Vapour pressure in July – Humidity at 2 PM in July – Annual total of sunshine hours – Mean annual cloudiness – Number of days with 10% above the mean temperature – Annual evapotranspiration – Wind roses and air pressure at sea level in January – Wind roses and air pressure at sea level in April – Wind roses and air pressure at sea level in July – Wind roses and air pressure at sea level in October |
|
25.
|
Climate: Climatic regions – Average date of flowering of the hazel – Average date of flowering of the acacia 1925–1940 – Average date of flowering of the wheat 1949–1954 – Average date of flowering of the maize 1948–1954 | |
26. |
Hydrography of the Carpathian Basin before the river regulations – Mean annual specific water discharge | |
27. |
Hydrogeological units – Mineral and medicinal waters |
|
28. |
Hydrogeological map of surface waters – Major data on the Hungarian section of the Danube and Tisza rivers | |
29. |
Pollution of surface waters – Ground-water level | |
30. |
Distribution of some important species of trees – Climatic zones of vegetation – Floristic-phytogeographical divisions | |
31. |
Reconstructed natural vegetation | |
32. |
Faunal divisions of Hungary and its surroundings | |
33. |
Soil degradation | |
34-35. |
Genetic soil map | |
36. |
Natural landscape units | |
37. |
POPULATION, SETTLEMENTS (44.1 MB) | |
38-39. |
Density of population and the regional distribution of population, 1 January 1960 | |
40. |
Hungarian population of the countries of the world | |
41. |
Mother tongue, 31 December 1920 – Mother tongue, 1 January 1960 | |
42. |
Population increase 1900–1960 – Distribution of population according to the age and gender of employers and dependents | |
43. |
Ratio and distribution of population in the outskirts, 1 January 1960 | |
44. |
Balance of labour force 1960 – Occupation of population according to the census of 1960 | |
45. |
Settlement types | |
46-47. |
Distribution of population by settlements according to occupation, 1 January 1960 | |
48. |
Births 1964 – Deaths 1964 – Natural increase 1964 – Actual increase 1964 – Urban population 1949–1965 | |
49. |
AGRICULTURE (49 MB) | |
50. |
Land reform I – Land reform II – Distribution of landed property 1935 – Distribution of landed property 1948 – State farms, 1 January 1966 | |
51. |
Land use: Arable lands – Meadows – Vineyards – Gardens – Orchards – Pastures – Reeds – Forests | |
52. |
Number of tractors and population density in 1962 – Tractor-ploughs – Tractor-drawn reaping-machines – Combines – Threshing-machines | |
53. |
Irrigation, fishing – Use of artificial fertilizers 1964 | |
54-55. |
Land cultivation | |
56. |
Plant production: Wheat – Rye – Rice | |
57. |
Plant production: Winter barley – Oat – Maize | |
58. |
Plant production: Spring barley – Sugar beet – Fibre hemp | |
59. |
Plant production: Fibre flax – Tobacco – Sunflower | |
60. |
Plant production: Rape – Oil flax – Potato | |
61. |
Plant production: Medic – Red clover – Green maize and maize for silage | |
62. |
Plant production: Forage beet – Wet fodder – Medic grain – Root medic grain – Red clover grain – Green paprika – Tomato – Onion | |
63. |
Wine-growing areas 19964 – Changes in the vine-growing areas 1935–1964 – Distribution of vine-growing 1964 – Average yield of grape 1964 – Wine production 1964 | |
64. |
Stock of fruit trees 1959 – Total stock of trees of orchards producing for market – Stock of bearing trees of orchards producing for market – Apple tree – Pear tree | |
65. |
Quince-pear tree – Cherry tree – Sour cherry tree – Plumb tree – Apricot tree – Peach tree – Mandel tree – Walnut tree | |
66. |
Forests 1965 | |
67. |
Oak – Tanning wood – Beech – Hornbeam – Poplar – Acacia – Pine – Range of big games | |
68. |
Livestock – Cattle – Cow – Swine – Horse | |
69. |
Sheep – Hens – Duck – Goose – Turkey – Bee – Animal welfare I: medical attendance – Animal welfare II: institutions | |
70. |
Total procurement of plant and animal products in forints 1963 – Wheat – Rye – Rice – Potato | |
71. |
Sugar beet – Tobacco – Onion, cabbage, tomato – Grape, wine – Slaughter swine, slaughter cattle – Poultry – Egg – Milk | |
72. |
Average quality of the arable lands of cooperative farms 1964 | |
73. |
INDUSTRY (38.6 MB) | |
74-75. |
Socialist industry I. Major data 1963 | |
76. |
Socialist industry II, 1963 | |
77. |
Socialist industry III. Ratio of employers and their distribution according to social sectors 1963 | |
78-79. |
Socialist industry IV | |
80. |
Coal mining and coal processing 1963 – Electric energy industry, power stations and transmission lines 1963 | |
81. |
Petroleum industry, production and processing of oil and natural gas, oil and gas pipelines 1963 | |
82. |
Production of iron, steel and non-ferrous metals 1963 – Mechanical engineering and metal ware industry 1963 | |
83 |
Production of vehicles 1963 – Precision, communication and vacuum engineering 1963 | |
84. |
Chemical industry 1963 – Construction industry I, 1963 | |
85. |
Construction industry II, 1963 – Construction industry III, 1963 | |
86. |
Timber industry I, 1963 – Timber industry II, 1963 | |
87. |
Paper and printing industry 1963 – Leather and skin industry 1963 | |
88. |
Textile industry I, 1963 – Textile industry II, 1963 | |
89. |
Food industry I, 1963 – Food industry II, 1963 | |
90. |
Food industry III, 1963 – Food industry IV, 1963 | |
91. |
Food industry V, 1963 – Food industry VI, 1963 | |
92. |
Number of employers in industry before 1945 – Increase of the number of employers in the state industry between 1945 and 1965 | |
93. |
TRANSPORTATION, TELECOMMUNICATIONS (23.9 MB) | |
94-95. |
Transport network | |
96. |
Traffic load of public roads according to the number of passing vehicles 1963 – Traffic load of public roads according to the weight of passing vehicles 1963 | |
97. |
Passenger train traffic 1965 – Navigable waterways 1966 | |
98. |
Radio, television 1966 – Daily papers 1966 | |
99. |
RETAIL TRADE, TOURISM, FOREIGN TRADE, INTERNATIONAL RELATIONS (30.5 MB) | |
100. |
Regional distribution of foods trade in shops 1964 – Regional distribution of clothes trade 1964 – Regional distribution of miscellaneous industrial goods trade 1964 | |
101. |
Regional distribution of catering trade 1964 – Regional distribution of retail trade 1964 – Regional distribution of the selling areas of shops 1964 | |
102. |
Tourism accommodation 1964 | |
103. |
Foreign trade 1965 | |
104. |
Diplomatic relations 1 March 1966 | |
105. |
CULTURAL AND SOCIAL FACILITIES (35.1 MB) | |
106. |
Secondary education and qualifications – Higher education and qualifications | |
107. |
Radio subscribers 1964 – Television subscribers 1964 – Borrowing of books (local libraries) 1964 – Cinema-goers 1964 – Seating capacity and visitors of theatres 1964 | |
108. |
Public health I. Panel doctor service 1965 – Public health II. Hospital beds 1964 – Infants’ nursery 1965 – Kindergartens 1965 – Housing conditions I. Residences 1960 – Housing conditions II. Living rooms 1960 – Public utilities I. Water supply 1960 – Public utilities II. Bathrooms 1960 | |
109. |
Nature protection, historic buildings, archaeology, public baths | |
110-111. |
Industry and agriculture | |
112. |
Public administration 31 March 1966 | |
| SUPPLEMENT: ADMINISTRATIVE MAP OF THE HUNGARIAN PEOPLE’S REPUBLIC 1 : 500 000 (45.8 MB) | ||